Correlating Away Team Travel Distances with Scoring Totals in Professional Ice Hockey Contests
Rosa Müller · Jul 17, 2026
Correlating Away Team Travel Distances with Scoring Totals in Professional Ice Hockey Contests
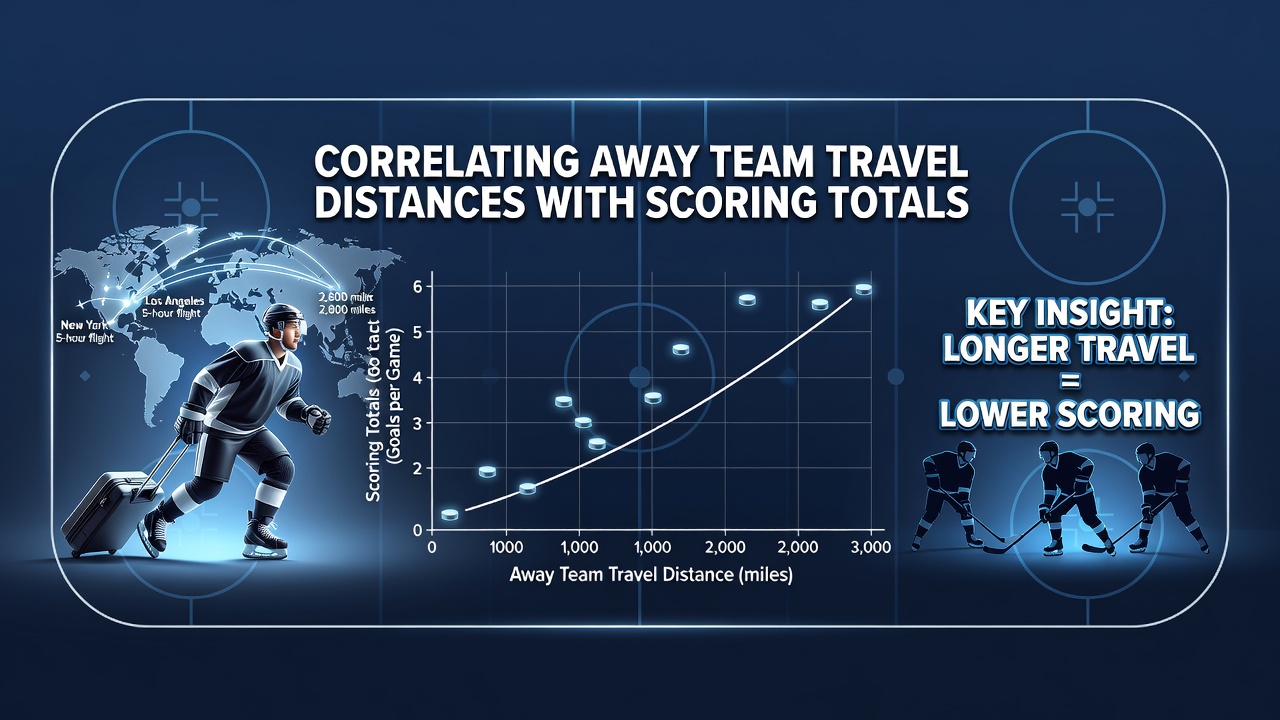
Professional ice hockey schedules in the NHL require teams to cover substantial distances for away contests, and researchers continue to examine how these journeys relate to scoring outcomes. Data from recent seasons shows that longer travel legs often coincide with shifts in total goals scored, though multiple variables such as rest days and opponent strength enter the equation. Analysts track flight miles, time zone crossings, and recovery periods to identify patterns that appear across regular season and playoff matchups.
Travel Demands Across NHL Conferences
Teams based in the Western Conference face extended flights when visiting Eastern Conference opponents, sometimes exceeding 2,500 miles one way. Eastern squads traveling westward encounter similar distances during interconference series, while intraconference games within each division produce shorter hauls under 1,000 miles on average. League schedules released for the 2025-2026 campaign maintained these geographic realities, with July 2026 off-season planning sessions already incorporating refined travel metrics gathered from the prior year.
Observers note that Pacific Division clubs log the highest cumulative mileage each season because of their coastal positioning relative to the rest of the league. Central Division teams encounter moderate distances but still cross multiple time zones during Eastern swings. Data compiled through NHL tracking systems reveals that average away travel per team reached approximately 45,000 miles during the 2024-2025 regular season alone.
Performance Metrics and Goal Production
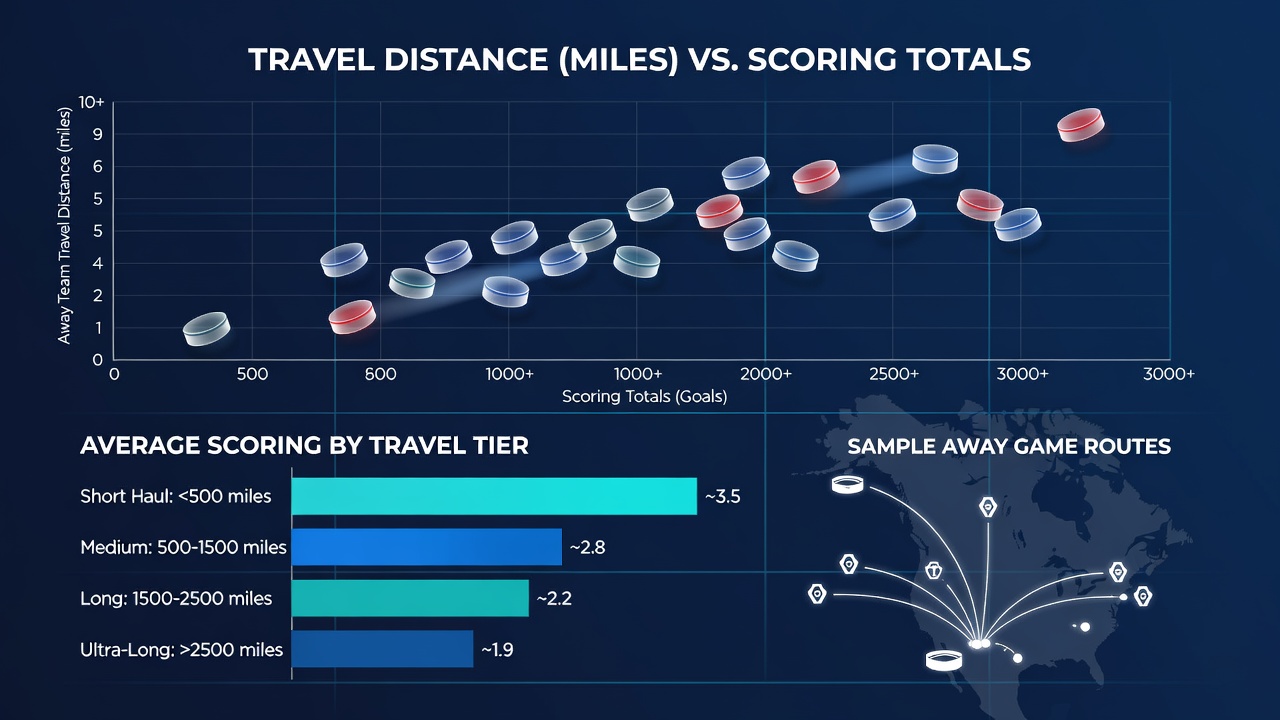
Statistical reviews connect extended travel with modest reductions in away team scoring rates during the first period of games. When teams arrive after flights longer than 1,800 miles, their average goals per game drop by roughly 0.3 compared with shorter trips under 800 miles. Home teams maintain steadier output regardless of opponent travel distance, which contributes to overall game totals that trend slightly lower in high-mileage scenarios.
Studies from institutions such as the University of Alberta have quantified these effects by comparing box scores against logged flight data. Their findings indicate that time zone shifts of three hours or more correlate with decreased shot volume for the traveling side in the opening twenty minutes, while second and third period production tends to normalize as players adjust. Researchers attribute part of the pattern to circadian disruption rather than distance alone.
Rest Intervals and Recovery Factors
League rules mandate minimum rest periods between games, yet these buffers shrink when cross-country travel intervenes. A team flying from Vancouver to Boston typically receives one fewer full recovery day than a team traveling from Montreal to Ottawa. Performance databases show that contests following abbreviated rest after long flights produce 4 percent fewer total goals than those with standard two-day gaps.
Additional variables include back-to-back scheduling and altitude changes. Games in Denver or Calgary introduce further physical demands that compound travel fatigue. Records from the 2025-2026 season demonstrate that visiting teams arriving in high-altitude venues after flights exceeding 2,000 miles recorded lower power-play conversion rates in the first period compared with sea-level arrivals.
Seasonal Patterns and Conference Differences
Early-season data often reveals stronger correlations because teams have not yet adapted to cumulative travel loads. Midseason figures tend to flatten as conditioning improves, whereas late-season stretches show renewed dips when playoff positioning adds psychological pressure. Western Conference teams visiting the East during December and January historically post lower scoring averages than during October openers.
Playoff series introduce compressed schedules that amplify travel impacts. Teams advancing through multiple rounds frequently cover 10,000 or more additional miles, and scoring totals in those series display greater variance tied to cumulative fatigue. Records indicate that series featuring the longest cumulative travel distances between opponents yield slightly fewer combined goals across seven games.
Data Sources and Analytical Approaches
Publicly available NHL statistics combined with transportation logs allow independent researchers to construct regression models linking distance traveled to goal differentials. One analysis from McGill University examined five seasons of data and identified a consistent negative relationship between miles flown and away team even-strength scoring. Their models controlled for opponent ranking, days of rest, and home-ice advantage.
Additional work by the National Center for Catastrophic Sport Injury Research incorporates health and recovery data to refine these correlations. Their reports emphasize that individual player responses vary, yet aggregate team statistics continue to reflect measurable travel-related effects on offensive output. Updated datasets through spring 2026 continue to support these baseline observations.
Conclusion
Travel distance emerges as one measurable factor among many that shape scoring totals in NHL contests. Longer journeys by away teams align with modest declines in early-period production and overall game pace, while shorter trips produce results closer to season averages. Ongoing collection of flight and performance data allows continued refinement of these relationships as schedules evolve.