Cross-Referencing Referee Crew Tendencies with Corner Kick Distributions in Championship Matches
Rosa Sullivan · Jul 27, 2026
Cross-Referencing Referee Crew Tendencies with Corner Kick Distributions in Championship Matches
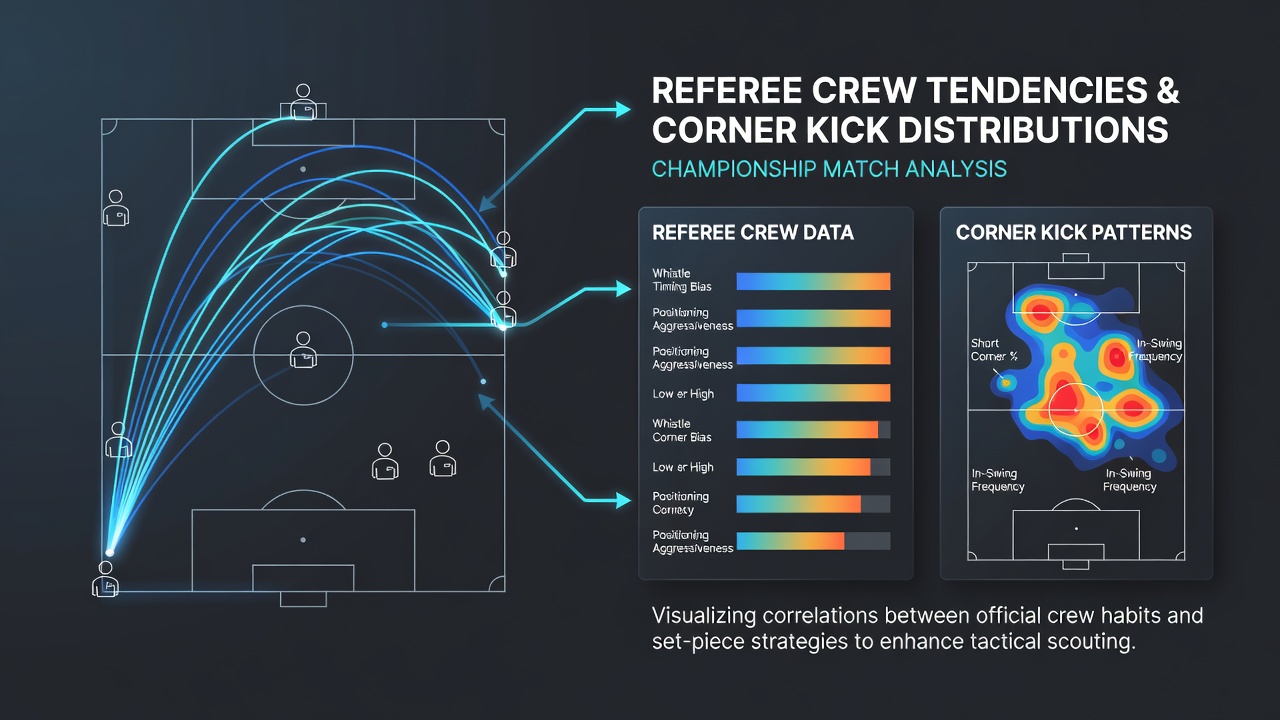
Analysts examining Championship matches have long tracked how referee crews shape corner kick volumes through their handling of fouls, challenges, and set-piece decisions. Data from recent seasons shows consistent patterns where certain officials award higher numbers of corners while others maintain tighter control over physical play in wide areas. These variations become clearer when crews receive cross-referenced evaluation against team attacking styles and pitch conditions.
Referee Crew Profiles and Corner Award Rates
Studies of Championship fixtures reveal that referee crews differ markedly in their threshold for awarding corners after aerial duels or deflected crosses. Some crews issue corners at rates exceeding 11 per game on average, particularly when they allow extended physical contests near the byline. Other crews reduce those totals closer to 8 per match by intervening earlier on marginal challenges. Observers note that this spread aligns with documented tendencies in foul distribution, where stricter interpretation of holding or shirt-pulling often funnels play into restarts that produce additional corners.
Records from the 2024-2025 campaign illustrate these differences across more than 550 matches. Crews led by officials with higher foul-per-game averages generated elevated corner counts in 62 percent of their assignments. The pattern holds when adjusted for team possession metrics, suggesting referee style exerts an independent influence rather than simply reflecting dominant sides forcing repeated entries into the box.
Corner Kick Distributions Across Venues and Times
Distribution data further shows clustering by venue and kick-off slot. Midweek evening fixtures under floodlights produced wider spreads in corner totals compared with weekend afternoon games, even when the same crews officiated. Pitch dimensions play a documented role as well, with narrower fields correlating to higher corner frequencies because clearances more frequently exit play near the goal line.
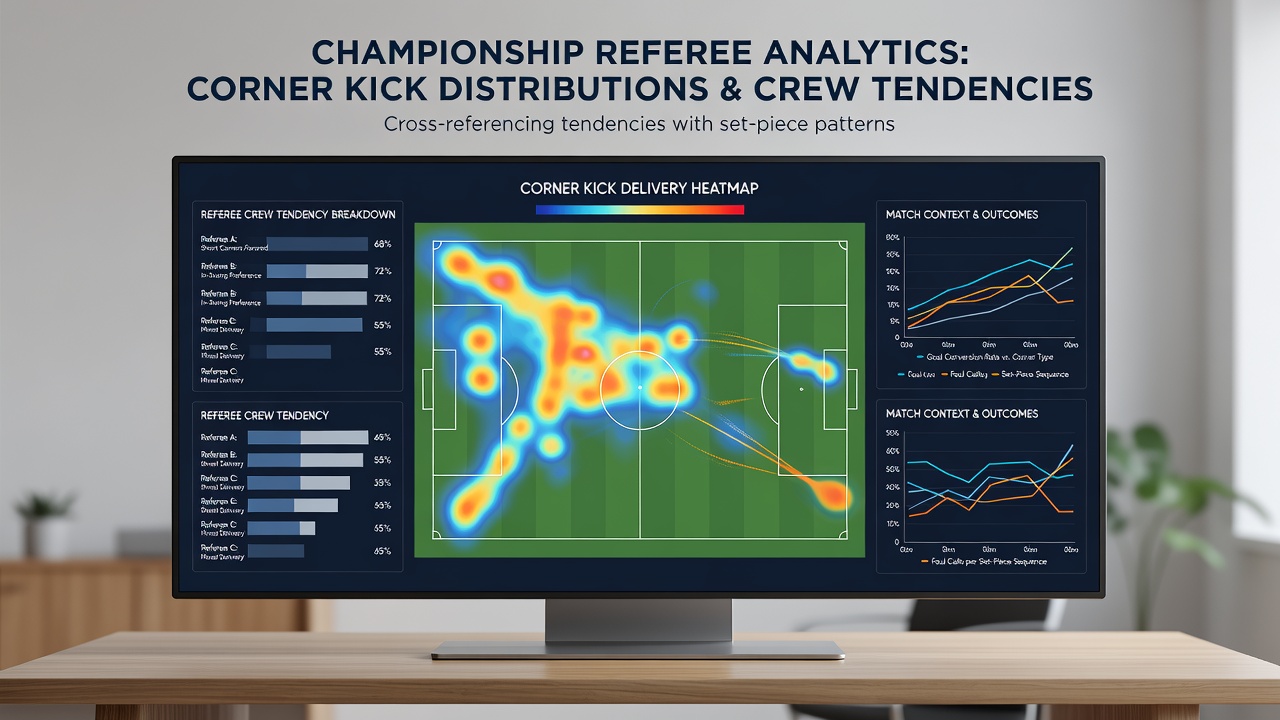
Teams that favor high crosses and overlapping full-backs generate predictable corner spikes under crews known for lenient wide-area adjudication. Conversely, sides relying on short combinations and central progression see fewer corners regardless of teh assigned crew. Analysts cross-tabulate these team profiles with historical crew data to isolate the referee variable, and the resulting matrices indicate that certain crews amplify corner output by 15 to 20 percent when paired with direct attacking sides.
Cross-Referencing Methodology in Practice
Effective cross-referencing combines multiple data layers. First, crews receive baseline scores derived from corner awards per 90 minutes across at least 30 prior Championship assignments. Second, these scores adjust for opponent attacking volume and average duel intensity in the final third. Third, researchers layer in contextual factors such as temperature, precipitation, and time of season. The combined dataset allows comparison of expected versus observed corner totals for any given fixture.
Figures compiled ahead of the July 2026 season preparations already incorporate expanded tracking of video assistant referee interventions on corner decisions. Early indications suggest that VAR-reviewed incidents reduce overall corner variance by flagging clear errors in real time, yet crew-to-crew differences persist in the initial on-field calls that trigger those reviews.
One dataset released through European football analytics networks demonstrates how crews with elevated card issuance rates also produce corner distributions skewed toward the second half of matches. The late-game increase appears linked to fatigue-driven challenges that officials interpret more strictly as the match progresses. Such temporal patterns add another dimension to predictive models used by performance analysts.
Integration with Broader Match Metrics
Corner kick distributions intersect with other referee-influenced statistics including throw-ins, goal kicks, and penalty awards. When crews maintain consistent wide-area thresholds, the entire set-piece ecosystem shifts in measurable ways. Teams preparing set-piece routines therefore review crew history alongside their own delivery profiles to anticipate volume and location biases.
Academic research from sports science departments in Canada and Australia has examined similar referee effects in comparable leagues, confirming that individual officiating styles produce statistically significant deviations in restart counts. These findings support the value of maintaining updated crew databases that include corner-specific metrics alongside traditional foul adn card data.
Conclusion
Cross-referencing referee crew tendencies with corner kick distributions supplies a structured framework for understanding variance in Championship matches. The approach integrates historical crew records, team attacking patterns, and environmental variables into a single analytical layer. As data collection expands through enhanced tracking systems, the precision of these comparisons continues to improve, offering clearer insight into how officiating decisions shape one of the most measurable aspects of match play.