Decoding Shot Attempt Correlations from Power Play Data for Variance Control in Daily Fantasy Hockey Lineups
Rosa Sullivan · Aug 26, 2026
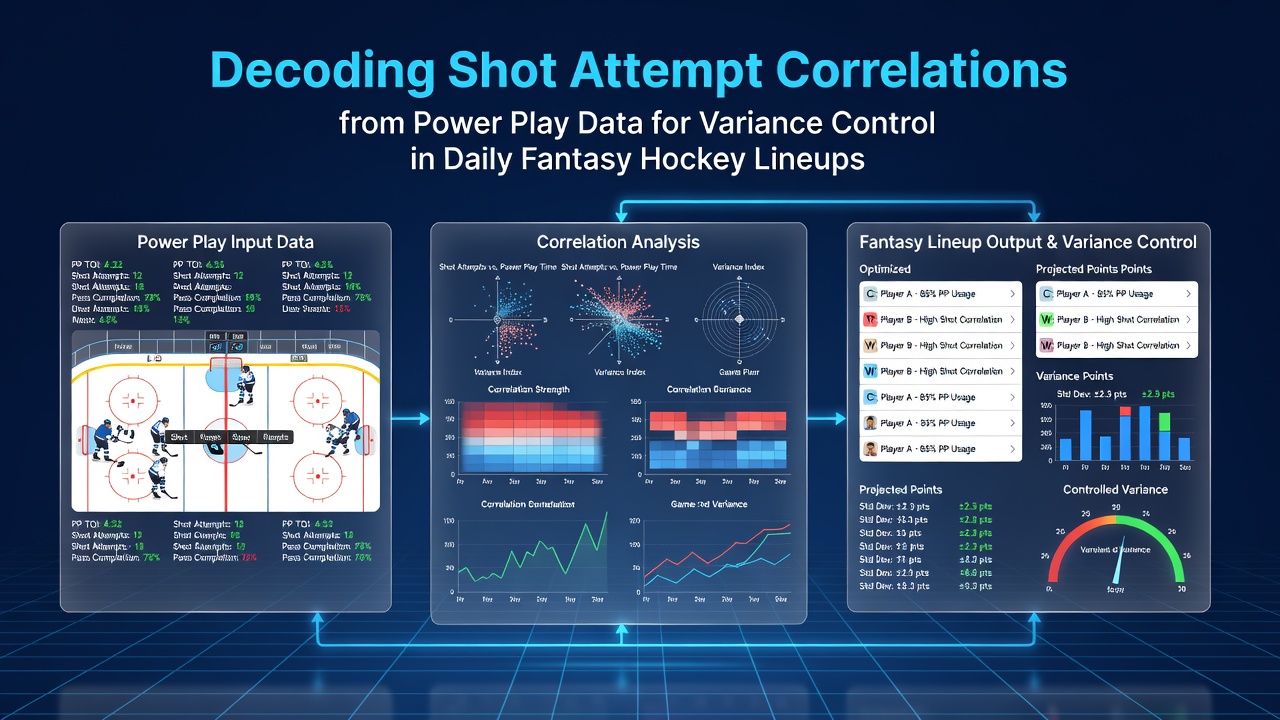
Decoding Shot Attempt Correlations from Power Play Data for Variance Control in Daily Fantasy Hockey Lineups
Power play data in the NHL offers structured metrics that daily fantasy hockey participants examine when constructing lineups, and shot attempt correlations emerge as one measurable element within those special teams situations. Analysts track these patterns across multiple seasons because power play opportunities generate elevated shot volumes compared to even-strength play, which creates opportunities to identify player pairings that produce consistent output. In August 2026, updated datasets from the prior campaign became available through league channels, allowing fresh correlation reviews ahead of the new season.
Power Play Shot Attempt Basics
Shot attempts during power plays include shots on goal, missed shots, and blocked attempts, and the NHL records these figures at both team and individual levels. Data compiled on NHL.com shows that teams average between 8 and 12 shot attempts per two-minute power play, with top units exceeding those marks when they maintain puck possession in the offensive zone. Individual skaters on the point or in the slot position record higher attempt rates because their locations align with high-danger areas, and these numbers feed directly into fantasy scoring systems that award points for shots.
Correlations appear when researchers compare shot attempt totals from power play minutes against overall player performance across full games. Studies of the 2024-25 season revealed that forwards who posted above-average power play shot rates also tended to register elevated even-strength shot totals in subsequent games, though the strength of this relationship varied by position and team deployment. Defensemen who quarterback power play units often show steadier correlations because their shot attempts originate from consistent locations on the ice.
Measuring Correlations for Lineup Construction
Daily fantasy platforms calculate variance based on the range of possible point outcomes for each player, and power play shot attempt data supplies one input that can narrow those ranges. When a player logs significant power play time and converts a stable percentage of those attempts into shots, the resulting fantasy points become more predictable across a slate of games. Lineup builders examine rolling averages of power play shot attempts over 10-game or 20-game windows to detect whether recent trends align with seasonal norms.
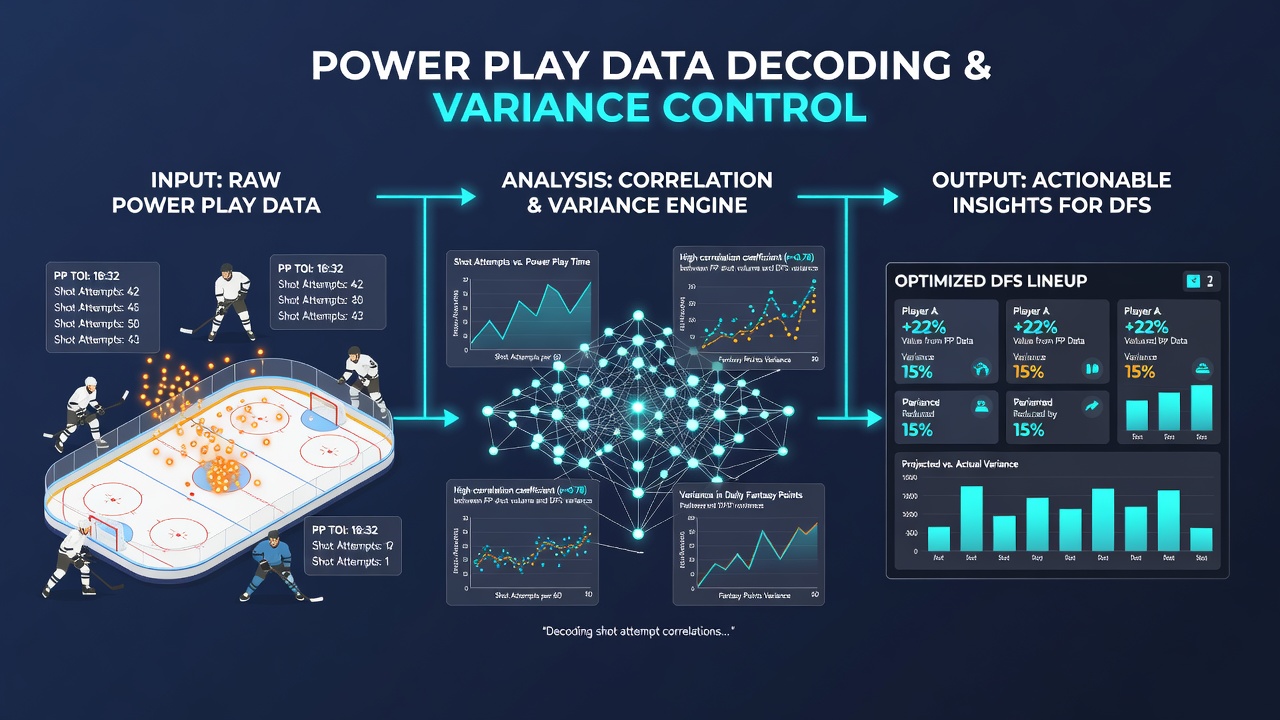
One method involves calculating Pearson correlation coefficients between power play shot attempts and fantasy points scored. Values above 0.4 indicate moderate positive relationships in many datasets, while coefficients near zero suggest that power play volume alone does not reliably predict scoring. Teams that generate high shot attempt rates on the power play but allow frequent counterattacks at even strength can produce noisier outcomes for their skaters, which increases lineup variance when those players are selected.
Application Across Positions and Team Contexts
Centers and wingers who occupy the net-front area during power plays record shot attempt correlations that differ from those of perimeter players. Net-front specialists convert attempts into actual shots at higher rates when they screen goaltenders effectively, and historical figures indicate these players maintain more stable point projections when their power play units remain intact. Power play quarterbacks, typically defensemen, influence multiple teammates because their passes create secondary shot opportunities; tracking both primary and secondary shot attempts provides a fuller picture of the unit's output.
Coaching changes and injury replacements alter these correlations quickly. When a new power play specialist joins a top unit in August 2026 training camp reports, early exhibition data supplies preliminary signals, though sample sizes remain small until regular-season games accumulate. Observers note that teams with stable special teams coaching staffs tend to preserve shot attempt patterns across seasons, which reduces uncertainty for fantasy projections.
Variance Reduction Techniques
Stacking multiple players from the same power play unit represents one common approach, yet the correlated shot attempt data can either amplify or dampen overall lineup variance depending on the underlying relationships. When two forwards on the same unit both post high power play shot attempt rates and their attempts show positive correlation, the stack increases the probability of combined point spikes, which lowers the chance of complete lineup failure but raises the ceiling. Diversifying across multiple teams with uncorrelated power play shot profiles spreads risk more evenly across the slate.
Salary cap constraints on daily fantasy sites force trade-offs between high-shot-attempt power play players and lower-priced options with steadier even-strength roles. Filtering lineups by power play shot attempt correlation thresholds allows builders to identify combinations that meet minimum floor requirements while respecting budget limits. Software tools that incorporate NHL tracking data now include these metrics as optional filters, and usage rates for such tools increased during the 2025-26 season according to platform reports.
Conclusion
Shot attempt correlations derived from power play data supply measurable inputs that daily fantasy hockey participants incorporate when managing lineup variance. The relationships between special teams volume and overall performance vary by position, team, and deployment, so ongoing analysis of updated NHL figures remains necessary. As datasets expand through the 2026-27 campaign, refined correlation models will continue to inform selection processes that balance upside potential against outcome stability.