Exploring Payout Frequency Correlations in Multi-Line Video Slots from State Gaming Commission Archives
Zoe Schulz · Jul 20, 2026
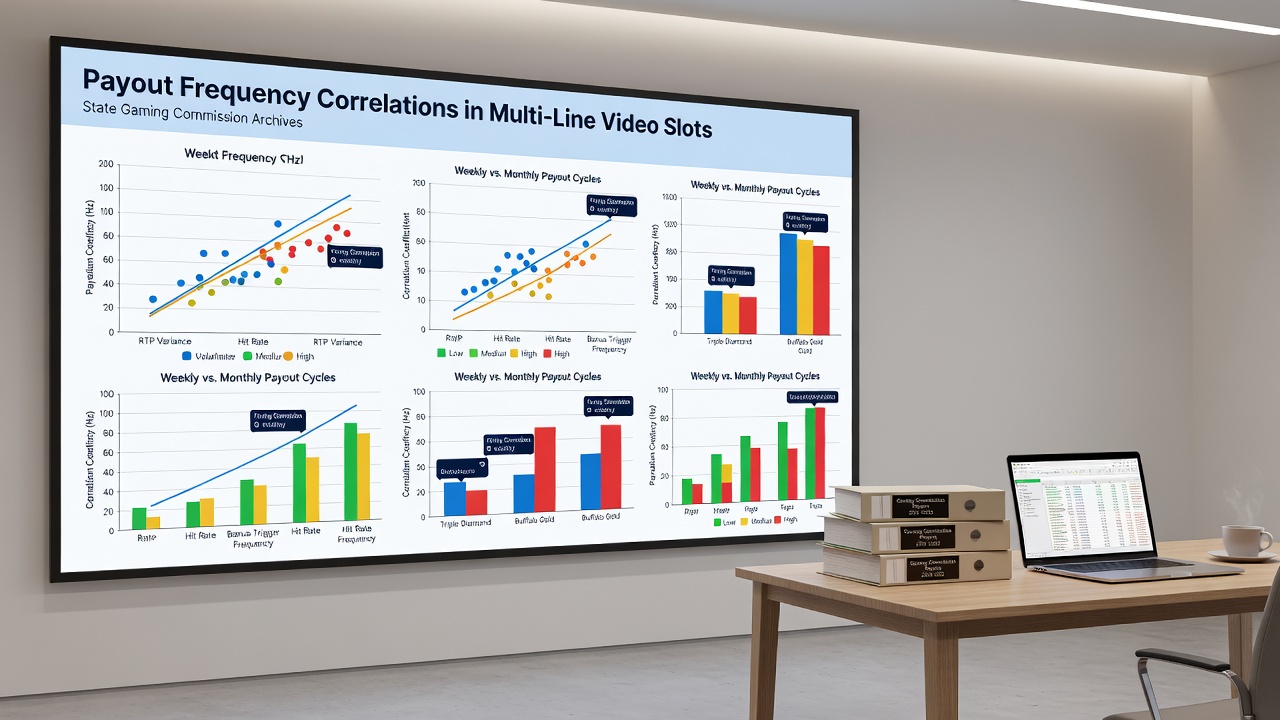
Exploring Payout Frequency Correlations in Multi-Line Video Slots from State Gaming Commission Archives
Multi-line video slots generate extensive records through mandatory reporting to state regulators, and these archives contain detailed logs of payout frequencies across thousands of machines operating under different configurations. Analysts examine these datasets to identify how the number of active paylines influences hit rates and overall return patterns, drawing from jurisdictions that maintain public or semi-public archives such as Nevada and New Jersey. Data compiled through July 2026 continues to expand these collections, offering researchers longer time series for correlation studies.
Core Mechanics of Multi-Line Video Slots
Modern video slots allow players to activate anywhere from one to several hundred paylines on a single spin, and each additional line increases the probability that a winning combination will register somewhere on the reel grid. Payout frequency refers to the proportion of spins that produce at least one winning outcome, while correlation analysis measures how changes in line count affect that proportion across identical reel sets. State archives record these outcomes at the machine level, including denomination, theoretical return percentage, and actual performance over millions of plays, which permits direct comparison of machines with different line settings.
Accessing and Structuring Archive Data
Regulatory bodies publish monthly or quarterly slot performance summaries that list aggregate coin-in, coin-out, and win percentages by game type. Researchers extract machine-specific files where available and align them with manufacturer specifications on payline counts to construct matched samples. The Nevada Gaming Control Board maintains one of the most extensive public repositories, while the New Jersey Division of Gaming Enforcement supplies comparable figures for Atlantic City properties. Cross-referencing these sources allows analysts to control for variables such as reel strip design and bonus frequency when isolating the effect of payline quantity.
Observed Correlations in Payout Frequency
Studies of archive records indicate that increasing active lines from one to twenty-five typically raises hit frequency by a factor proportional to the added coverage of the reel grid, although the relationship is not perfectly linear once overlapping symbol combinations are accounted for. Machines configured with fifty or more lines show elevated hit rates per spin, yet the average payout per winning spin tends to decrease because smaller line wins dilute the distribution of returns. Data from multi-year periods reveal that this pattern holds across both low-denomination penny slots and higher-stakes five-dollar machines, suggesting the correlation stems primarily from geometry rather than bet size alone.
Regional Comparisons and Recent Figures
Archives from different states display consistent directional trends despite variations in reporting formats. Pennsylvania and Michigan reports, for instance, document similar increases in hit frequency when operators introduce versions of the same title with expanded line counts. These patterns persist after adjusting for differences in average bet and session length, supporting the view that payline architecture exerts an independent influence. Analysts note that progressive jackpot titles sometimes deviate from the general pattern because large top awards occur too infrequently to affect short-term frequency metrics.

Methodological Considerations in Archive Analysis
Proper correlation work requires matching machines that share identical reel strips and bonus mechanics while differing only in the number of selectable lines. Researchers apply regression models that include controls for time of day, floor location, and player tracking data when available. Outliers arising from software updates or hardware replacements are flagged through version control logs maintained by operators and submitted to regulators. Such filtering produces cleaner estimates of the marginal effect of each additional payline on observed hit rates.
Implications for Game Design and Regulatory Oversight
Manufacturers use these archive-derived correlations when calibrating new titles, adjusting line counts to achieve target hit frequencies that balance player engagement with house-edge requirements. Regulators in turn reference the same data when evaluating whether proposed configurations meet disclosure standards for theoretical return percentages. Ongoing collection of machine-level records through 2026 and beyond will permit more granular examination of how volatility interacts with line count, particularly in titles that incorporate dynamic payline activation or cluster-pay mechanics.
Conclusion
State gaming commission archives supply the raw material for systematic investigation of payout frequency in multi-line video slots. By aligning performance metrics with machine specifications across multiple jurisdictions, analysts identify stable correlations between payline quantity and hit rates that persist across denominations and time periods. Continued expansion of these public datasets supports increasingly precise modeling of slot outcomes and informs both operational decisions and regulatory review processes.