Fatigue correlations in consecutive NHL road games: how travel distance and rest differentials shift puck line outcomes from 2015 onward
Sage Lang · Aug 7, 2026
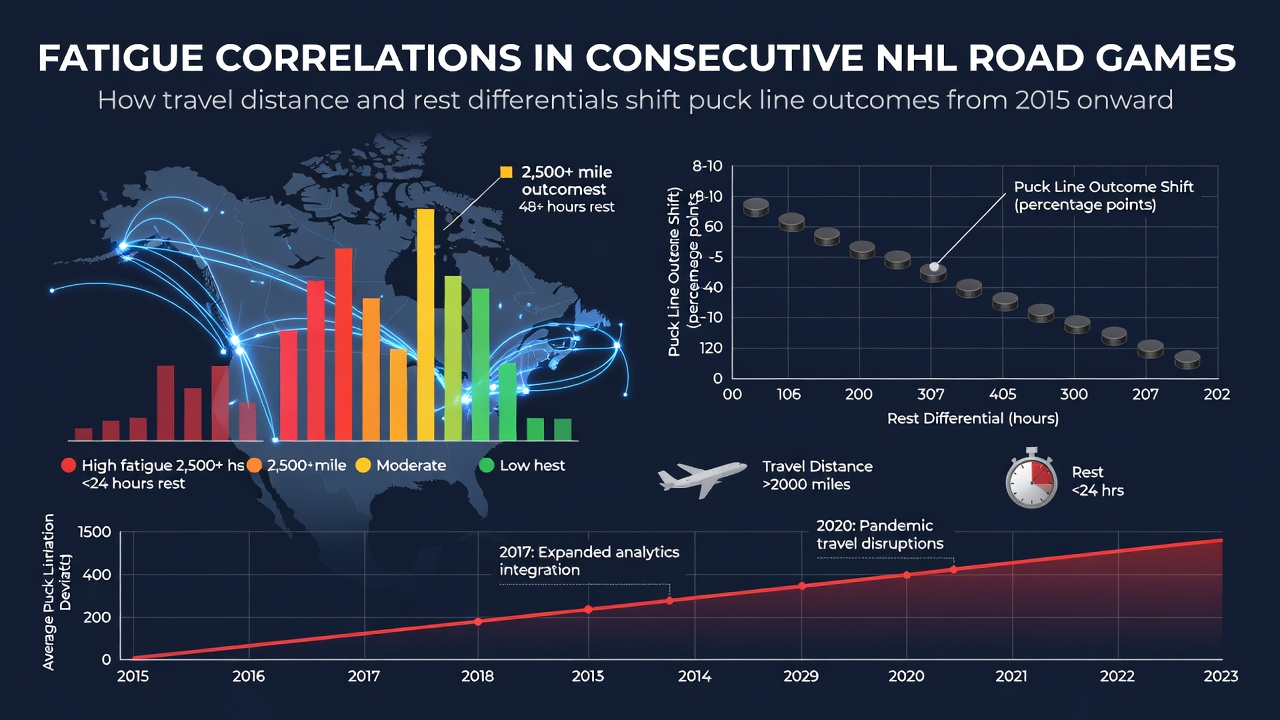
Fatigue correlations in consecutive NHL road games: how travel distance and rest differentials shift puck line outcomes from 2015 onward
Consecutive road games in the NHL create measurable fatigue patterns that influence puck line results, and data collected since the 2015 season tracks how travel miles and rest gaps alter those outcomes in consistent ways. Analysts review schedule logs alongside betting market records to identify when visiting teams cover or fail to cover the puck line based on those variables alone.
Travel distance effects on team performance
Longer flights across multiple time zones correlate with reduced goal differentials for road teams, while shorter regional hops show smaller shifts in puck line coverage rates. Researchers at academic institutions have compiled flight data from NHL seasons starting in 2015, and those records indicate that cross-country trips exceeding 2,000 miles coincide with visiting clubs winning by two or more goals at lower frequencies than expected.
Teams that complete a game in one city and then travel overnight to another market the next day face added recovery demands, and performance metrics reflect those demands through fewer high-danger scoring chances. Figures from league tracking systems show that road squads logging the highest cumulative travel distances during back-to-back series post fewer shots on target, which directly affects whether they cover a -1.5 puck line or force the game under the total.
Rest differentials and schedule clustering
Rest gaps between games produce clearer patterns when one club receives an extra day off while its opponent plays on consecutive nights. Data sets covering the 2015 through 2025 seasons reveal that teams with one day of rest after a road contest cover the puck line at rates several percentage points below their season average when matched against opponents coming off two full days between games.
Schedule makers at the league level have adjusted back-to-back frequencies over the past decade, yet clusters still occur during divisional swings and western conference trips. Observers note that these clusters amplify the effect of rest differentials, particularly when a team finishes a three-game road trip and immediately faces another contest with limited recovery time.
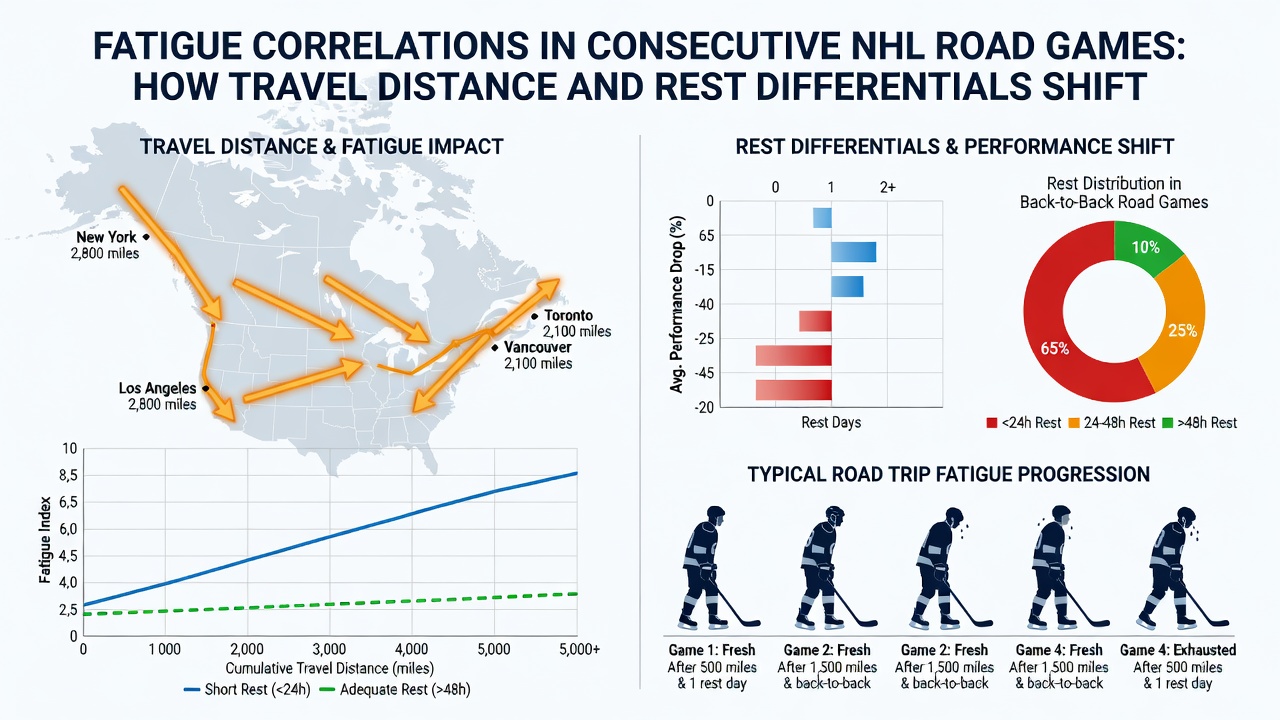
Documented puck line shifts since 2015
League-wide statistics demonstrate that road teams in consecutive games cover the +1.5 puck line more frequently when travel distance exceeds average thresholds, while home favorites cover the -1.5 line at elevated rates under the same conditions. Records maintained by the National Hockey League and independent statistical services confirm these directional changes across more than 8,000 regular-season games played between 2015 and the conclusion of the 2024-2025 campaign.
Western Conference clubs traveling east for multi-game series encounter the steepest drops in puck line success, and eastern teams heading west show similar though slightly milder trends. Those patterns hold after controlling for opponent strength and home-ice advantage, according to analyses released by research groups focused on North American professional sports.
Playoff qualification races in March and April intensify schedule density, and teams already eliminated from postseason contention sometimes exhibit different responses to the same travel and rest variables. Data from those late-season windows continues to feed models used by performance staff to anticipate when fatigue may tip a contest one way or the other on the puck line.
Regional and seasonal variations
Canadian markets experience distinct travel profiles because of geography and border logistics, and records from Statistics Canada alongside league data illustrate how those routes add incremental fatigue compared with purely domestic U.S. swings. Teams based in western Canada that play consecutive games in the northeast corridor post lower puck line coverage rates than their U.S. counterparts on similar mileage.
August 2026 schedule releases will determine the next cycle of road-trip clusters, and front offices already compare projected travel loads against historical puck line outcomes to plan rest management protocols. Those preparations draw directly from the decade-long data set that began in 2015 and continues to expand each season.
Conclusion
Travel distance and rest differentials produce measurable, repeatable effects on NHL puck line results from 2015 onward, and the patterns remain visible across multiple seasons and conference alignments. Continued collection of schedule, flight, and performance data will allow further refinement of those correlations as the league moves through future campaigns.