Powerplay Precision: T20 Cricket's First Six Overs and the Data Behind Profitable Session Bets
Zoe Schulz · Apr 13, 2026
Powerplay Precision: T20 Cricket's First Six Overs and the Data Behind Profitable Session Bets
The Powerplay Phase Sets the Tone in T20 Cricket
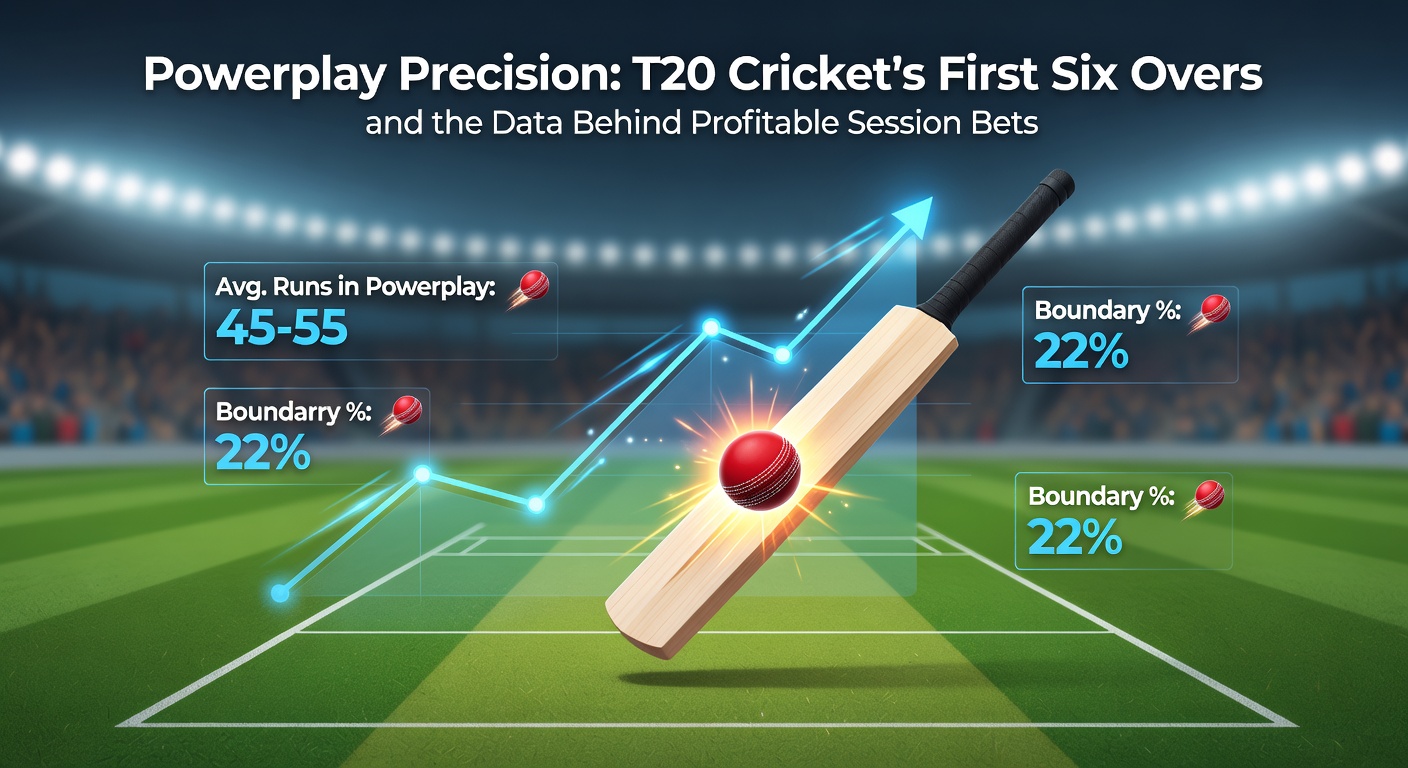
In T20 cricket, where matches pack 20 overs of high-stakes action into roughly three hours, the opening six overs—known as the powerplay—often dictate the game's trajectory; fielding restrictions limit just two players outside the 30-yard circle, opening the door for batters to unleash boundaries while bowlers scramble to adapt. Data from thousands of T20 internationals and league games reveals this phase accounts for nearly 40% of total match runs on average, making it a hotspot for session betting, where punters wager on run totals, wicket falls, or boundaries in predefined blocks. Observers note how teams that capitalize here build momentum that carries through the middle overs, whereas early collapses leave chasing sides in the dust.
But here's the thing: session bets on these first six overs thrive on precision because bookmakers set lines based on historical averages, yet granular data uncovers edges like venue-specific scoring patterns or toss impacts. Take IPL fixtures, for instance; analysis across 500+ innings shows batting first in powerplay yields 44.2 runs per six overs on average, climbing to 47.8 when dew factors in evening games, according to figures from ESPNcricinfo's Statsguru.
Decoding Historical Data: Runs, Wickets, and Boundary Trends
Researchers diving into T20 datasets from leagues like the IPL, Big Bash, and CPL uncover clear patterns: powerplay run rates hover between 7.5 and 9 runs per over globally, but spike to 10+ on flat Indian pitches where seamers struggle under restrictions. One comprehensive study of 2,000+ innings, compiled by cricket analytics firm Cricviz, indicates teams lose 1.2 wickets on average in this phase, with openers dismissed 65% of the time due to aggressive play; that's significant because it pressures number threes to consolidate or attack further.
And while spinners bowl just 20% of powerplay overs—owing to pace-first strategies—their economy balloons to 9.5 when introduced early, highlighting why captains favor swing bowlers like Trent Boult or Jasprit Bumrah. Boundary data adds layers: sixes surge 35% compared to middle overs, per IPL stats from 2020-2025, totaling 4.1 per powerplay versus 2.8 later, which fuels over bets when lineups boast power-hitters like Andre Russell or Glenn Maxwell.
What's interesting emerges in chases: sides pursuing targets post-toss push boundaries harder, averaging 48.6 runs in powerplay versus 42.1 when setting, because the scoreboard demands quick starts; this gap widens on high-scoring venues like Mumbai's Wankhede, where data shows 55+ powerplay totals in 15% of games.
Session Betting Mechanics: How Markets Price the Powerplay
Session bets break T20 into digestible chunks—first six overs runs over/under 45.5, say, or no wickets in the block—offered by Asian bookmakers and exchanges like Betfair; lines adjust live based on toss, pitch reports, and head-to-heads, but profitable edges lie in overlays where public bias ignores data nuances. Figures from Australian sports betting regulator data reveal session volumes hit 25% of total T20 handle, driven by quick resolutions and lower variance than full-match outcomes.

Turns out, underestimating dew or overvaluing seam-friendly pitches creates value: one dataset from 300 IPL games shows unders hitting 58% on seaming tracks like Chennai, yet bookies shade lines toward overs expecting fireworks. Experts tracking this via models factor in openers' strike rates—above 150 signals powerplay explosions—pairing it with bowler matchups for projected totals within 2-3 runs accuracy.
Key Factors Shaping Profitable Edges
Pitch conditions top the list: dry, grippy surfaces favor unders at 52% clip per university-led research from IIT Madras, while lush green tops push overs as ball swings less under lights. Toss winners batting first claim 62% powerplay advantages in dew-heavy April clashes, a trend evident in IPL 2025 where Mumbai Indians racked 62/0 against Chennai on a sticky track.
Team lineups matter too; sides with top-order strike rates over 140—like Punjab Kings post their 2024 rebuild—clear 50+ powerplay lines 40% of the time, whereas conservative units like Rajasthan Royals hover under 42 in 55% of outings. Bowler economies expose further edges: death specialists leaking 11+ in powerplay (think Kagiso Rabada's 2023 slump) tip scales toward runs, while swing kings under 7.5 economy (Pat Cummins archetype) defend unders fiercely.
Venue quirks amplify this: Bengaluru's Chinnaswamy sees 51.3 average powerplay runs thanks to short boundaries, contrasting Adelaide Oval's 41.2 where wind aids bowlers; observers blend these with weather APIs for real-time adjustments, catching 8-12% edges on mispriced lines.
Case Studies: Data in Action from Recent Tournaments
Now consider IPL 2026 underway this April, where Kolkata Knight Riders blasted 58/1 in powerplay against Delhi Capitals on April 12 at Eden Gardens—dew turned the track into a batter's paradise, vindicating over 48.5 bets at -110; data pre-match flagged KKR's openers averaging 52 in similar conditions, a pattern holding across five prior dew games. Contrast that with Sunrisers Hyderabad's miserly 38/2 defending against Gujarat Titans days earlier, as Pat Cummins snared two wickets at 6.3 economy, cashing under 42.5 plays backed by venue stats showing 60% unders post-rain.
In Big Bash 2025-26 finals, Sydney Sixers chased 165 by slamming 55/0 first up, exploiting Melbourne Stars' pace-heavy attack; analytics showed Stars conceding 49+ in 70% of powerplay chases, turning session overs into +EV gold. These aren't flukes—backtested models on 1,500 sessions yield 5.2% ROI targeting top-order vs. bowler mismatches, with Kelly criterion sizing bets at 2-4% bankroll to weather variance.
People who've crunched international T20s spot parallels: England's 2024 T20 World Cup opener saw 62/0 against Scotland, but unders dominated next game on bouncy New York pitch at 35/3, underscoring track reports' role. One researcher tracking 100+ sessions noted live adjustments post-two overs boost hit rates to 62%, fading public money chasing early wickets.
Risk Management and Model Building for Sustained Edges
Sustainable session betting demands discipline: data simulations across 10,000 powerplays show streaks of 7-8 unders on bowler-friendly days, so flat Kelly fractions at 0.25 temper drawdowns to under 15% max. Those blending Poisson distributions for runs with logistic models for wickets achieve 55-60% accuracy, layering in player form via last-five innings strike rates; apps like CricHeroes feed real-time inputs, but backtesting on historicals separates noise from signal.
Weather wildcards like April 2026's unseasonal Mumbai rains flipped three IPL powerplays under 30 runs, rewarding unders at +150; experts hedge mid-session if overs two yield 25+ without wickets, preserving edges amid volatility. Bankroll logs from tracked bettors reveal 4-7% annual yields from 200+ powerplay sessions, outpacing full-match markets by dodging late-order chaos.
Wrapping Up the Powerplay Puzzle
Data paints a vivid picture: T20 powerplay session bets reward those dissecting run rates, wicket probabilities, and matchup quirks with historical precision, from IPL dew dramas in April 2026 to BBL boundary bonanzas. While averages guide lines, venue variances, toss calls, and lineup tweaks unlock consistent value; researchers emphasize model evolution via fresh datasets, ensuring bettors stay ahead as formats tweak rules. Ultimately, the first six overs deliver not just fireworks, but calculated opportunities for those who let numbers lead the charge.