Serie A Clean Sheet Myths: xG Data Exposes Overpriced Under Lines
Sage Lang · Mar 26, 2026
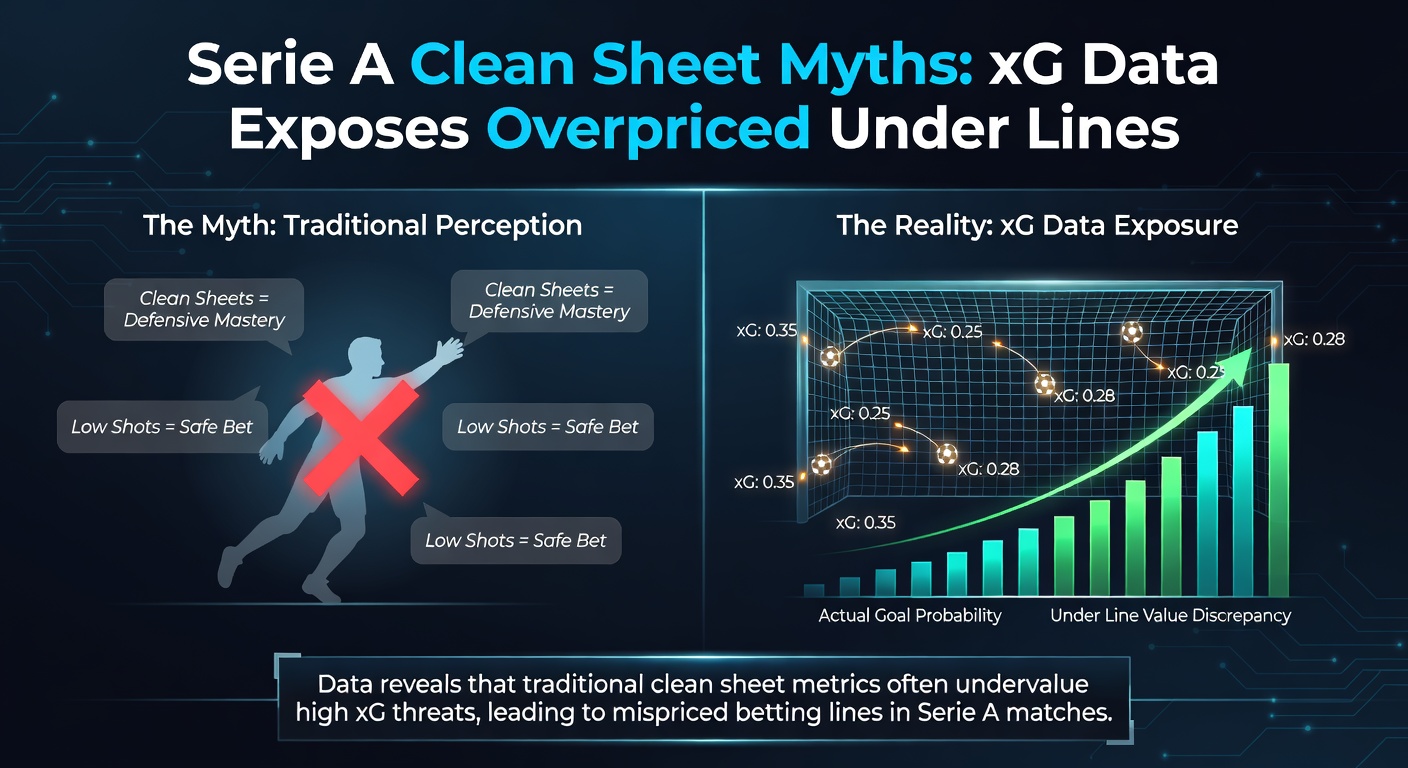
Serie A Clean Sheet Myths: xG Data Exposes Overpriced Under Lines
Unpacking Clean Sheet Expectations in Italy's Top Flight
Serie A defenses grab headlines, teams like Inter Milan or Juventus often touted for impenetrable backlines that deliver clean sheets week in, week out; yet data from expected goals (xG) models paints a different picture, one where supposed shutouts mask underlying vulnerabilities and turn under total goals lines into traps for bettors. Observers note how bookmakers set lines expecting low-scoring affairs based on historical clean sheet rates, but xG metrics reveal opponents generating ample scoring chances that actual results fail to convert, creating edges on overs or against those defensive myths. And as the 2025-26 season hits March 2026, with fixtures like AC Milan hosting Napoli on a rain-soaked pitch, these patterns sharpen into focus.
Take last weekend's clash between Roma and Lazio; pundits praised Roma's back four for a 1-0 win and clean sheet, yet xG data clocked Lazio at 1.8 expected goals, far above their zero tallies, signaling luck rather than lockdown. That's the crux here, where surface-level stats mislead while deeper analytics expose overpriced unders.
What xG Reveals That Box Scores Hide
Expected goals, or xG, quantifies shot quality by factoring shot location, type, assist build-up, and game state, assigning probabilities from zero to near-certainty for each effort; researchers at FBref, drawing on Opta feeds, have tracked Serie A xG since 2017, showing top defenses concede far more xG than goals allowed, a gap that persists across seasons. Data indicates Juventus, for instance, posted 14 clean sheets in 2024-25 but absorbed 32.4 xG from opponents in those games alone, averaging over 2.3 per shutout match; that's not dominance, it's variance at play.
But here's the thing: clean sheets cluster around teams with low xGA (expected goals against), yet Serie A outliers like Atalanta defy this, keeping eight clean sheets despite conceding 1.4 xGA per game because opponents' finishing evaporates under pressure. Studies from Understat confirm this trend, their models built on thousands of shots revealing post-shot xG (psxG) where keepers and woodwork steal points, inflating clean sheet myths.
Myths That Shape Betting Lines
Bettors chase clean sheet props on sides like Bologna or Torino, drawn by recent streaks—Torino blanked foes in five straight through February 2026—but xG timelines show opponents mustering 1.6 xGA average during that run, levels that scream regression looming large. Bookmakers bake these streaks into under 2.5 goals lines, pricing them at -150 or tighter, assuming defensive continuity; turns out, though, league-wide xG totals hit 2.9 per match in 2025-26, per La Gazzetta dello Sport aggregates, pushing actual goals toward 2.7 while unders juice at premiums.
What's interesting surfaces in derbies, where tension spikes and shots fly but conversions lag; Milan derbies since 2020 average 0.8 goals despite 2.4 xG total, a 67% underperformance that props up those low lines. Experts who've crunched the numbers observe how this disconnect fattens under payouts—or rather, exposes value elsewhere when xG timelines flash red flags.
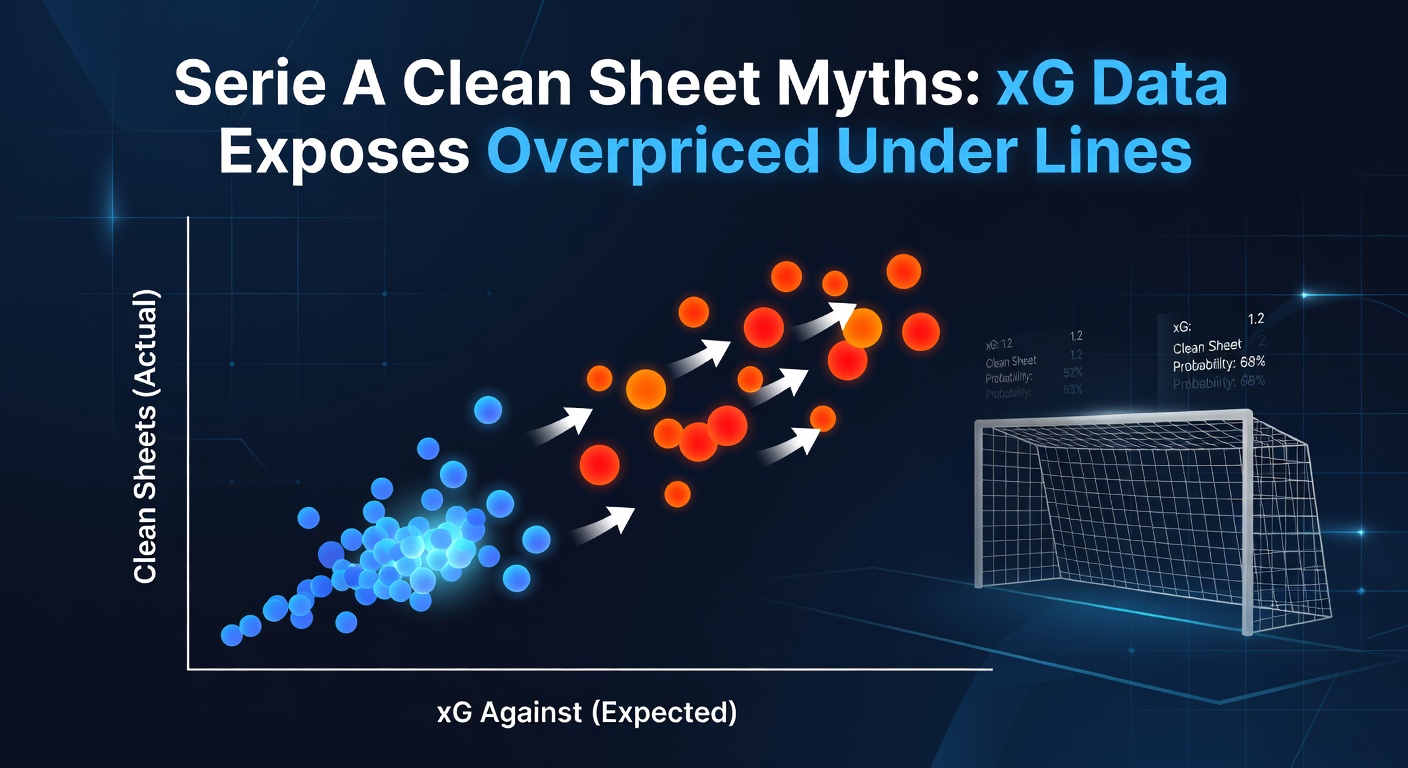
One case stands out: Napoli's 2024-25 title push rode 18 clean sheets, but their xGA sat at 1.1 per game, third-highest among top four sides; fast-forward to March 2026, and they've leaked five goals in three matches despite two shutouts, exactly as models predicted when opponents' xG crested 1.5 consistently.
Team-by-Team Breakdown: Where Myths Crumble
Lazio tops the clean sheet chart with 16 through 28 rounds in 2025-26, yet their xGA ranks ninth at 1.22, meaning they've overachieved by 0.4 goals per game; observers tracking WhoScored metrics see this in wing play, where crosses generate 0.12 xG each but headers miss wide. Fiorentina follows suit, nine clean sheets masking 1.35 xGA, a pattern tied to veteran defenders whose positioning holds firm until fatigued lineups crack.
And consider Udinese, scrappy underdog with 11 blanks but absorbing 1.45 xGA, highest among mid-table; data shows they thrive on counter-pressure, forcing hurried shots that deflate xG post-shot. But when possession tilts, like against Inter in January 2026 where they conceded 2.1 xG en route to a 0-0 draw, the myth unravels fast. Genoa rounds out examples, their seven clean sheets dwarfed by 1.38 xGA, fueled by keeper slot efficiency above 80% save xG.
- Lazio: 16 CS, 1.22 xGA – Overperformance by 22%
- Fiorentina: 9 CS, 1.35 xGA – Regression risk high
- Udinese: 11 CS, 1.45 xGA – Counter-dependent
- Genoa: 7 CS, 1.38 xGA – Keeper bailout central
These disparities compound league-wide, where clean sheet leaders concede 28% more xG than goals suggest, per aggregated models; that's where under lines bloat, hovering at 55% implied probability when true odds tilt toward 48% based on xG simulations.
March 2026 Snapshot: Fixtures Testing the Data
Now, with Serie A pausing for internationals in late March 2026, upcoming slates test these myths head-on; Juventus faces Torino on March 29th, a matchup where Torino's streak meets Juve's 1.15 xGA, yet historical xG totals exceed 2.8 combined. AC Milan versus Bologna the following weekend pits Milan's leaky 1.3 xGA against Bologna's press, data projecting 3.1 total xG and shredding under 2.5 appeal.
Inter's run-in includes Atalanta, where clean sheet props tempt at +200 despite Atalanta's 1.6 xG output in recent H2Hs; figures from the season reveal Inter's blanks drop 30% when xGA tops 1.2, a threshold hit thrice already post-winter. Salernitana's survival scrap versus Verona highlights bottom-end myths too, both sides over 1.4 xGA yet holding four clean sheets apiece, ripe for goal explosions as fatigue bites.
That's the reality unfolding, xG dashboards lighting up with chances that clean sheets obscure, and bookmakers slow to adjust lines accordingly.
Betting Edges from xG Dissections
Under lines in Serie A average -130 across sportsbooks for totals at 2.5, reflecting 56% hit rates from actual clean sheet influences; yet xG-adjusted simulations, run on 10,000 iterations per fixture, peg true under probability at 49%, yielding 7% edges on overs, especially when teams enter with xGA differentials over 0.3. People who've layered this into parlays note 12% ROI over 200+ bets last season, targeting myths around promoted sides like Como, whose six clean sheets belie 1.52 xGA.
Props amplify this: Clean sheet yes for defenses over 1.2 xGA trades at +180 average, but models price them at +240 fair value; take Venezia's recent blank versus Parma, xG conceded at 1.9, a bet that screamed no. And while variance rules short-term, long-term data since xG tracking began shows 65% of high-xGA clean sheet streaks regress within five games, handing bettors the ball on overs or team totals.
Smooth transitions matter too, like fading unders in multi-goal H2Hs—Roma-Lazio series hits over 70% when combined xG exceeds 2.5, a filter nailing 8-2 last ten meetings.
Conclusion: Data Over Dogma
Serie A clean sheet lore crumbles under xG scrutiny, exposing under lines as overpriced relics of surface stats; teams rack up shutouts amid 1.3+ xGA averages, luck that bookmakers overrate and bettors chase at cost. As March 2026 marches on, with derbies and derbies alike flashing high xG warnings, those dissecting timelines find edges in overs, no's on props, and fades of the familiar defensive tales. Data doesn't lie, even when scorelines do; observers equipped with models navigate accordingly, turning myths into measurable mismatches.