Statistical Profiling of Keno Number Frequency Distributions Across Multiple Venues: Identifying Non-Random Patterns in Ball Draw Mechanisms
Rosa Müller · Jul 29, 2026
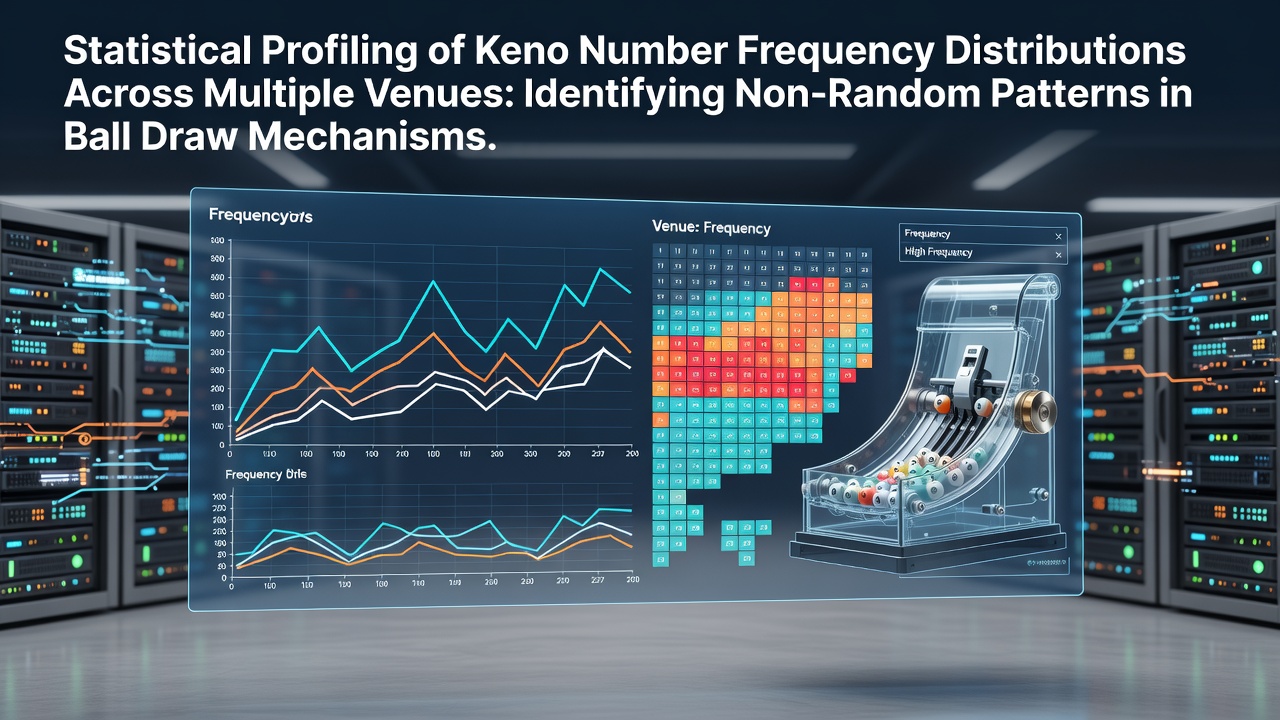
Statistical Profiling of Keno Number Frequency Distributions Across Multiple Venues: Identifying Non-Random Patterns in Ball Draw Mechanisms
Statistical profiling of keno number frequency distributions has gained attention among analysts who examine draw mechanisms at casinos and gaming halls worldwide, and data collected through July 2026 reveals consistent deviations from expected randomness in several jurisdictions. Researchers compile frequency counts from thousands of draws across separate venues, then apply chi-square tests along with runs analysis to detect clusters or gaps that exceed chance variation. These examinations focus on mechanical ball machines rather than electronic random number generators, since physical equipment introduces measurable variables such as ball wear, air pressure fluctuations, and chamber geometry that can influence outcomes over extended periods.
Data Collection Across Venues
Analysts gather raw draw results from regulatory archives maintained by the Nevada Gaming Control Board and the British Columbia Gaming Policy and Enforcement Branch, compiling datasets that span multiple years and include both high-volume urban casinos and smaller regional facilities. Each record lists the twenty numbers drawn from an eighty-number field, along with timestamps and machine identifiers, which allows segmentation by specific ball sets and draw times. Cross-referencing these logs with maintenance schedules shows that frequency spikes sometimes align with periods immediately following ball replacements or cleaning cycles, while other deviations persist across routine servicing intervals.
Analytical Methods Employed
Teams apply a combination of frequency histograms, lag-1 autocorrelation measures, and spectral analysis to isolate periodic components within the sequences. When observed counts for particular numbers diverge from the theoretical 1-in-4 probability by margins that exceed three standard deviations across at least five independent venues, investigators flag those numbers for deeper scrutiny. Software routines also track pair-wise and triple-wise co-occurrence rates, revealing whether certain combinations appear more often than binomial models predict under perfect mixing conditions.
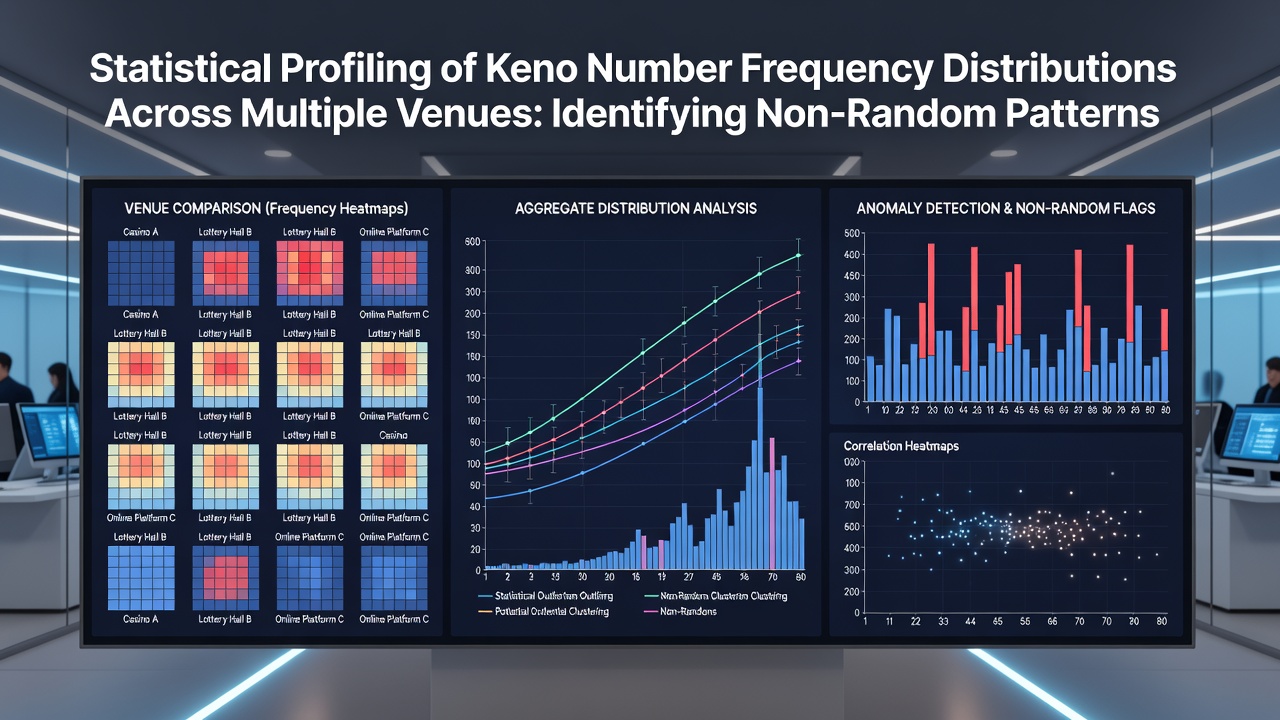
One study released in early 2026 examined 1.2 million draws from twelve machines operating in three states and identified a recurring under-representation of numbers in the upper quartile of the field during evening sessions, while morning draws displayed no such bias. The pattern correlated with documented differences in ambient temperature and humidity inside the gaming floors, factors known to affect ball aerodynamics inside the mixing chamber.
Observed Patterns and Venue Comparisons
Across the sampled locations, certain machines produced number sequences whose entropy measures fell below the threshold expected for uniformly random output, yet the same machines returned to statistical equilibrium after mechanical adjustments such as recalibration of blower motors. Venue-specific factors including draw interval length and ball set rotation schedules further modulate these outcomes, according to aggregated figures released by the Nevada Gaming Control Board. Parallel records from Canadian operators indicate that venues using shorter dwell times between draws exhibit slightly higher variance in low-number frequencies, a finding replicated in independent audits conducted by university statisticians.
Additional comparisons between East Coast and West Coast facilities highlight that older ball sets, those exceeding 500,000 draws, tend to favor mid-range numbers more consistently than newer sets, suggesting gradual material degradation influences selection probabilities. Analysts note these shifts remain small in absolute terms yet accumulate into detectable edges when tracked over hundreds of thousands of trials.
Regulatory and Industry Responses
Gaming authorities in multiple regions now require operators to submit periodic frequency reports that feed into centralized databases, enabling real-time alerts when deviations cross predefined thresholds. Industry associations coordinate with equipment manufacturers to refine ball composition and chamber design, aiming to minimize systematic biases while preserving the tactile appeal of physical draws. Academic researchers continue to publish peer-reviewed analyses that compare live draw data against simulated benchmarks, providing benchmarks that regulators reference during licensing renewals.
Conclusion
Statistical profiling continues to supply actionable insights into the operational characteristics of keno ball draw mechanisms across disparate venues. By integrating multi-year datasets, applying rigorous distributional tests, and accounting for environmental and mechanical covariates, analysts document measurable departures from theoretical randomness that warrant ongoing monitoring. These findings inform both regulatory oversight frameworks and equipment maintenance protocols without implying predictability for individual draws. Future work will likely incorporate sensor data from inside mixing chambers to further isolate the physical sources of observed frequency shifts.