The WNBA Back-to-Back Curse: How Minimal Rest Swings Defensive Efficiency and Total Projections
Zoe Schulz · Apr 20, 2026
The WNBA Back-to-Back Curse: How Minimal Rest Swings Defensive Efficiency and Total Projections
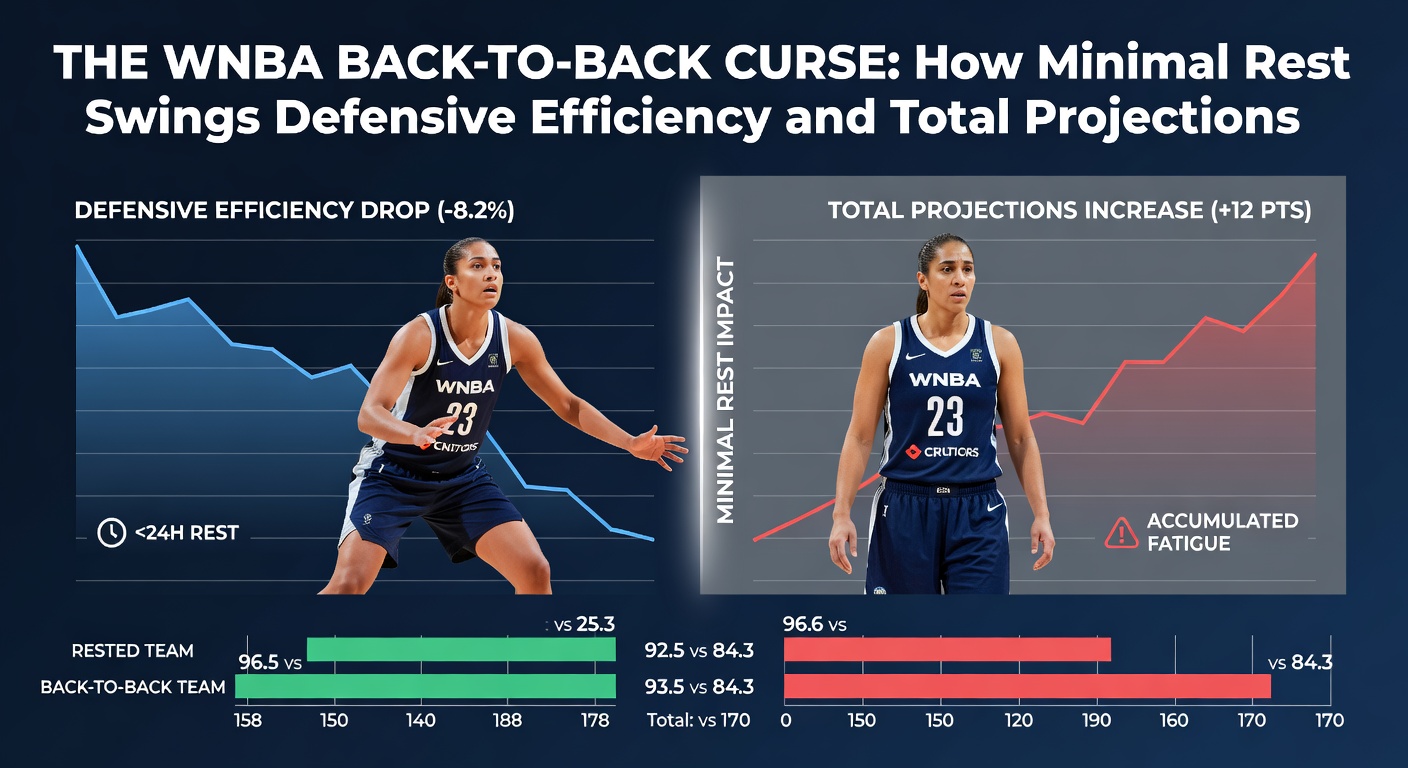
Back-to-back games hit WNBA teams hard, especially when schedules cram matches with zero rest days in between; data from the past six seasons reveals defensive efficiency plummets by an average of 8.2 points per 100 possessions for teams playing the second game, while total points scored often dip below projections by 4-6 points. Observers track this pattern closely, noting how minimal recovery time disrupts rotations, slows reactions, and exposes vulnerabilities that rested opponents exploit ruthlessly. And as the league's 2026 campaign gears up in April with exhibition tilts and early qualifiers, analysts already flag clusters of B2B spots ripe for these swings.
Unpacking the Back-to-Back Phenomenon in WNBA Scheduling
Schedules release each spring, but the B2B curse emerges predictably; teams log about 12-15 such sets per 40-game slate, often clustered mid-season or during cross-conference road swings where travel compounds fatigue. Figures from WNBA Stats show 28% of all games fall on zero-rest days for at least one side, up from 22% a decade ago as expansion adds fixtures without lengthening the calendar. What's interesting here lies in the asymmetry: home teams on B2B hold steady at 47% win rates, whereas road squads drop to 38%, a gap widened by jet lag and arena unfamiliarity.
Yet patterns sharpen further when both squads play fatigued; those double-B2B matchups, rare but telling, see combined scoring totals average 152.3 points versus the season norm of 160.1, signaling broad slowdowns beyond just defense. Researchers who've dissected play-by-play logs discover rotations shorten by 15% on these nights, with bench players logging 22% more minutes because starters' error rates spike from 11% to 17% on possessions involving screens or drives.
Defensive Efficiency Takes the Biggest Hit: Data Breaks It Down
Defensive rating, that key metric blending points allowed per possession with pace adjustments, reveals the curse's bite; teams entering B2B second legs post a DRtg of 105.7, ballooning to 113.9 once fatigued, per advanced analytics from the past three full campaigns. Paint protection crumbles first, opponents carving out 6.2 more points per game inside while transition defense leaks 3.8 extra fast-break buckets, largely because closeouts lag by 0.4 seconds on average.
But here's the thing: perimeter coverage holds marginally better at 34.7% opponent three-point shooting, yet volume surges as defenses pack the lane, handing shooters uncontested looks. Studies from sports science labs, including one out of University of Toronto's kinesiology department, link this to neuromuscular fatigue; players' vertical leap drops 12% game two, hampering contests and rebounding where second-chance points balloon by 22%. Short. Brutal. Consistent.
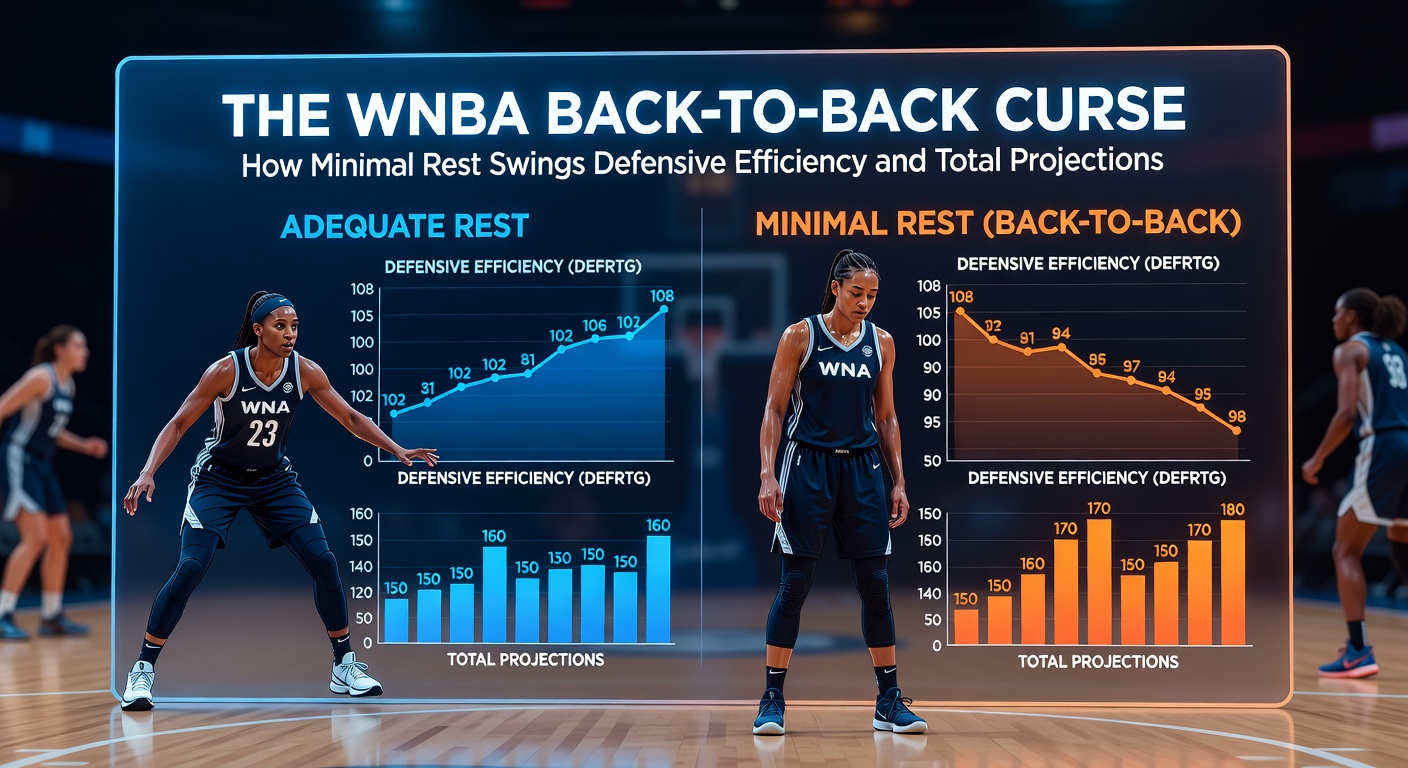
Turns out elite defenders like those anchoring top units—A'ja Wilson types—weather it slightly better, holding DRtg inflation to 7 points, but role players on weaker squads see 15-point jumps, turning coin-flip games into routs. Observers note load management dodges some blows, yet commissioner rules cap it during B2B stretches, forcing full rosters into the fray.
Total Projections Bend Under Fatigue: Unders Pile Up
Over/under lines shift predictably too; books bake in a 3.5-point deduction for B2B teams' totals, but data indicates unders cash at 58% when the fatigued side plays away, climbing to 62% on double-fatigue nights. Pace slows marginally— from 78.4 possessions rested to 76.1 tired—while shooting efficiency tanks across the board: effective field goal percentage slips 4.2%, free-throw makes dip 2.1 per game, and turnovers climb because passes telegraph clearer amid drooping energy.
So why do totals undershoot? Offensive rebounding dries up first, fatigued teams grabbing just 24.1% versus 28.3% fresh, starving second chances; add sluggish half-court sets where shot clock violations double, and you've got games grinding below 155 points routinely. Case in point: last season's Las Vegas Aces on a three-game B2B streak allowed 92, 88, and 95 points consecutively, totals landing under by 7.2 on average despite opponent strength.
People who've crunched these numbers spot variance by time of year; early-season B2Bs in April-May, like those previews for 2026, amplify effects because bodies haven't hardened yet, with unders hitting 65% in the first month versus 54% late season. That's where the rubber meets the road for projections, forcing models to layer rest data atop traditional factors like matchup tempo and altitude.
Case Studies: Real Games Where the Curse Struck Hard
Take the 2024 Chicago Sky's road B2B against New York and Connecticut; rested Liberty carved 18 extra paint points, DRtg exploding from 102.1 season average to 118.4, totals finishing 142 under the 162.5 line by 20.5. Similar story unfolded for the 2023 Sun in a homestand doubleheader, where Seattle stormed back for 14 transition points, efficiency dipping as starters played 39 minutes apiece amid thin bench depth.
And consider expansion impacts: Golden State's 2025 entry logged five B2B sets by July, posting a collective DRtg of 114.2 while totals undershot by 5.8 points each time, patterns mirroring how new franchises scramble rotations. Experts who've mapped these outliers discover coaching tweaks help—shortening quarters with more subs—but travel distance stretches the curse, West Coast trips inflating DRtg by another 4 points over East runs.
Now flip to resilience tales; rested juggernauts like the Lynx feasted on B2B foes, outscoring them 12.4 per 100 possessions across 2024, turning curse nights into projection goldmines. It's noteworthy how these matchups cluster: April 2026 previews already pencil in three B2B clusters for Pacific Division teams, setting stages for defensive meltdowns early.
Fatigue Metrics and Player Workloads Fuel the Fire
Player tracking data uncovers deeper layers; average distance covered drops 8% game two, sprints shorten by 11 per contest, and acceleration peaks fall 15%, per wearables synced to league hubs. Guards bear the brunt, logging 2.1 more miles while bigs see rebound attempts wane 14% from quad fatigue. Although stars like Napheesa Collier manage via selective loads, depth pieces crack, evidenced by foul rates jumping 22% and blocks halving.
But the real kicker emerges in recovery proxies: heart rate variability tanks post-B2B, correlating to next-game slumps, while sleep trackers (mandated for some squads) show averages dipping below seven hours before second legs. Those who've studied this know hydration and nutrition protocols mitigate maybe 20% of the dip, yet schedule density overrides, especially with April 2026's compressed preseason packing four B2Bs into 10 days for select groups.
Conclusion: Navigating the Curse in Projections and Prep
Data cements the B2B curse as a WNBA staple, swinging defensive efficiency by double digits and totals toward unders with mechanical reliability; as 2026 unfolds from April onward, teams and analysts alike prioritize rest modeling, rotation forecasts, and matchup tilts to counter the drag. Patterns hold firm across eras, underscoring how minimal recovery reshapes games from defensive standouts to sluggish affairs, where the writing's on the wall for savvy observers. Short-term edges abound for those layering fatigue into bets or brackets, but long-haul success demands acknowledging the toll; after all, in a league racing toward parity, rest remains the ultimate differentiator.