Travel Distance Correlations With College Basketball Performance and Betting Adjustments
Rosa Sullivan · Aug 17, 2026
Travel Distance Correlations With College Basketball Performance and Betting Adjustments
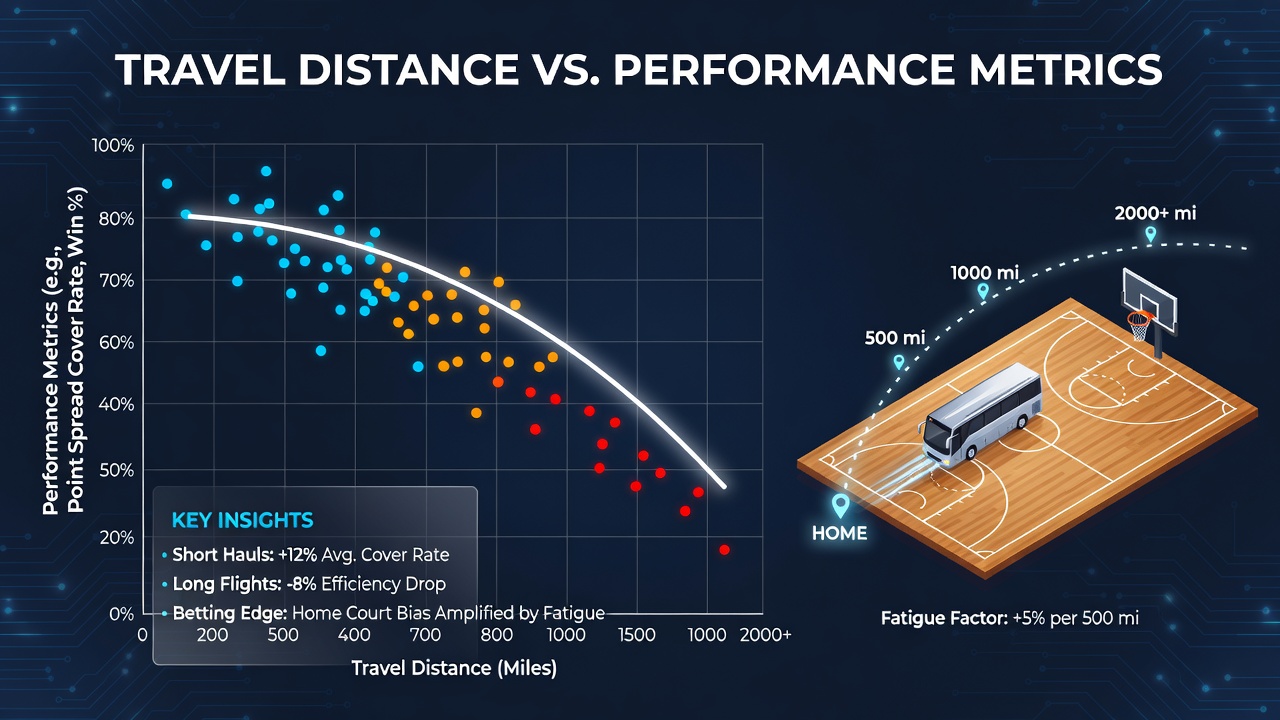
College basketball schedules force teams across long distances during conference play and non-conference tournaments, creating measurable effects on scoring efficiency, defensive rebound rates, and turnover percentages that betting markets track closely. Researchers at several Division I programs have compiled travel logs alongside box score data to quantify how miles flown or driven correlate with reduced field goal percentages and slower transition defense in subsequent games.
Measuring Travel Impact on Key Stats
Data from the 2024-2025 season shows teams logging more than 600 miles in the 48 hours before tipoff posted average drops of 4.2 points in offensive rating while allowing opponents an extra 3.1 points per 100 possessions on defensive end, according to aggregated conference reports. These shifts appear consistently across power conferences where back-to-back road games stretch recovery windows, and analysts note tighter spreads emerge when oddsmakers incorporate rest differentials into opening lines. Observers note that three-point shooting suffers most noticeably after cross-country flights, with volume shooters hitting 2.8 percent fewer attempts from beyond the arc in such scenarios.
Betting Market Responses to Distance Data
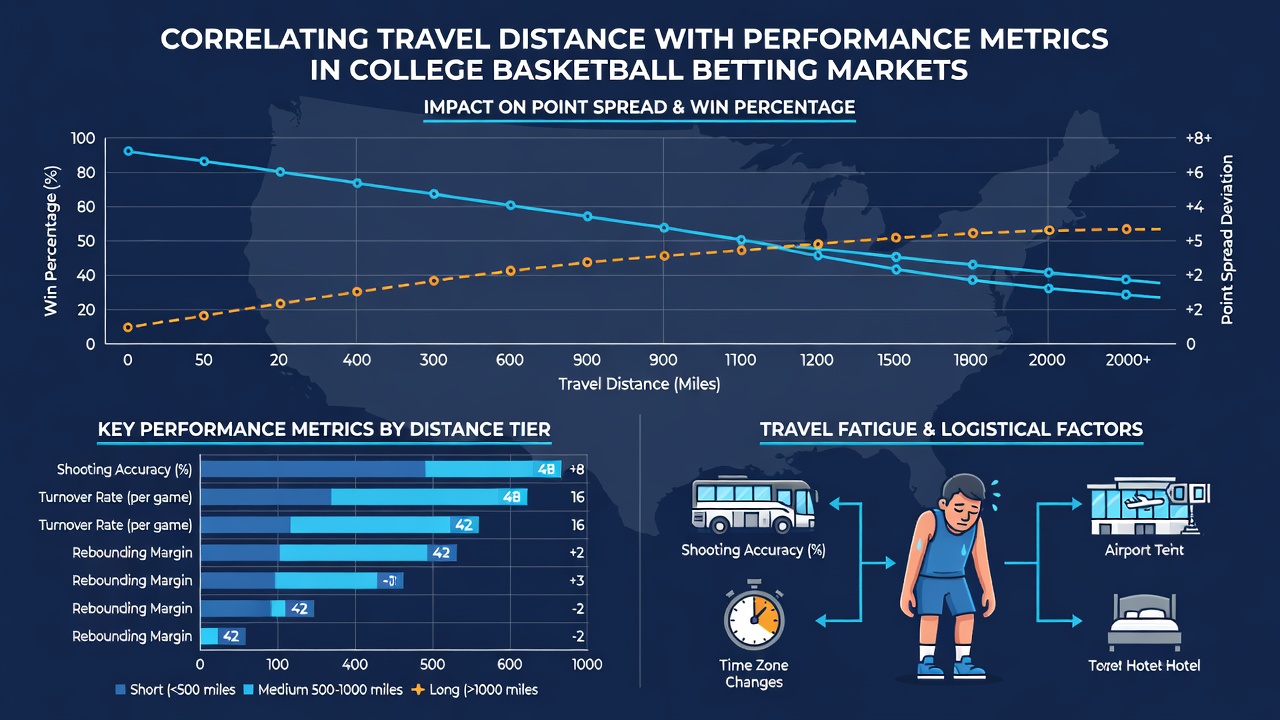
Betting markets adjust totals and spreads when travel distance exceeds typical regional hops, and sportsbooks have integrated proprietary fatigue models that factor flight time plus time zone changes. Lines for over/under totals move lower by an average of 3.5 points when visiting teams cross two time zones, while moneyline odds reflect corresponding adjustments in implied win probabilities. Figures from major sportsbooks indicate that sharp bettors targeting unders in these spots have captured positive returns over multi-season samples, particularly in mid-major conferences where roster depth limits rotation options during recovery periods.
One study tracking Atlantic Coast Conference squads found that teams returning from West Coast trips posted rebounding percentages 5.1 points below their season averages in the immediate follow-up contest, a pattern that surfaces repeatedly in both regular season and conference tournament play. Those metrics feed directly into pregame totals because reduced rebounding often leads to fewer second-chance opportunities and slower overall pace. What's interesting is how early season non-conference schedules amplify the effect, since many programs schedule long-haul trips before conference play begins and fatigue compounds across multiple weeks.
Seasonal Patterns and Conference Variations
August 2026 schedule releases already highlight several high-mileage matchups that will test these correlations once the new campaign begins, particularly for teams in geographically dispersed conferences. Power conference data reveals that teams averaging over 400 miles per road trip during a given month see a 6 percent increase in turnover rate, while free throw attempts decline as physical freshness wanes. Mid-major programs traveling via commercial flights rather than charters experience amplified effects, and betting syndicates have begun weighting these variables more heavily when constructing season-long totals projections.
Performance drops show up most clearly in defensive metrics after extended travel, with opponent field goal percentage rising as closeouts slow and help rotations lag. Researchers compiling multi-year datasets note that the correlation strengthens during February and March when cumulative travel miles peak and academic calendars limit practice time. Betting exchanges have responded by publishing adjusted line movements tied to distance thresholds, allowing bettors to see real-time shifts as travel manifests become public through official conference releases.
Regional and Schedule Factors
Geographic clustering within conferences influences how often teams face significant travel, with Western and Mountain West programs encountering longer average hauls than their Eastern counterparts. Data compiled across five seasons indicates that teams playing at elevation after sea-level travel suffer additional efficiency losses beyond pure distance effects, and oddsmakers incorporate altitude adjustments into their models. Conference tournament structures add another layer because quarterfinal and semifinal games sometimes require same-week travel between sites, further compressing recovery windows.
Those who've examined box scores alongside flight manifests observe that bench production dips after longer trips, with reserves logging fewer minutes at high efficiency levels due to slower adaptation to new environments. This pattern feeds into live betting markets where second-half totals often close under projected numbers when visitor rotation fatigue becomes evident on the court. NCAA scheduling guidelines attempt to balance competitive equity, yet long-distance requirements persist for television windows and revenue considerations, sustaining the data streams that betting markets continue to refine.
Conclusion
Travel distance continues to serve as a quantifiable input for performance modeling in college basketball, with metrics on shooting, rebounding, and turnovers showing consistent directional shifts that propagate into betting line construction. Markets incorporate these variables through evolving algorithms, while researchers expand datasets to capture conference-specific and schedule-driven nuances that emerge each season.